 |
|
Message boards : Number crunching : New region?
Message board moderation
Previous · 1 · 2 · 3 · 4
| Author | Message |
|---|---|
 Iain Inglis Iain InglisSend message Joined: 16 Jan 10 Posts: 1084 Credit: 7,944,701 RAC: 2,164 |
I got one of the WAH2 "global" models from batch #520: it actually covers the PNW25 region but for 145 months. The GFLOPS is 2,889,203 vs 3,907,164 for a PNW25/49 so it'll have to skip a lot of normal PNW25 processing to meet that GFLOPS estimate. The CPDN front page mentions a batch with "globally perturbed physics", so perhaps that's what the "global" means. (Apart from my ancient Mac, all my CPDN machines have failed - power supplies, hard disks, Ubuntu upgrade - so speed comparisons are not yet possible with older runs until a set of matching runs has been processed across all the replacement machines with WAH 8.12 in common with the Mac. A recent ANZ50/8 already looks very low on GFLOPS; the ANZ region definition is the same as HADAM3P illustrated earlier in this thread.) [Edit: The ancillary files reported in the work unit descriptions are clickable: if that was the case in the previous Web site version then I hadn't noticed it ...] |
 Iain Inglis Iain InglisSend message Joined: 16 Jan 10 Posts: 1084 Credit: 7,944,701 RAC: 2,164 |
I got one of the WAH2 "global" models from batch #520: it actually covers the PNW25 region but for 145 months. ... The time between Zips is about 90 minutes on my machine with each one being ~49 MB, so that's ~16 x 49 = 784 MB/day or 145 x 49 = ~7.1 GB/model. Mine crashed on the fourth Zip, but be warned ... |
 Byron Leigh Hatch @ team Carl ... Byron Leigh Hatch @ team Carl ...Send message Joined: 17 Aug 04 Posts: 289 Credit: 44,103,664 RAC: 0 |
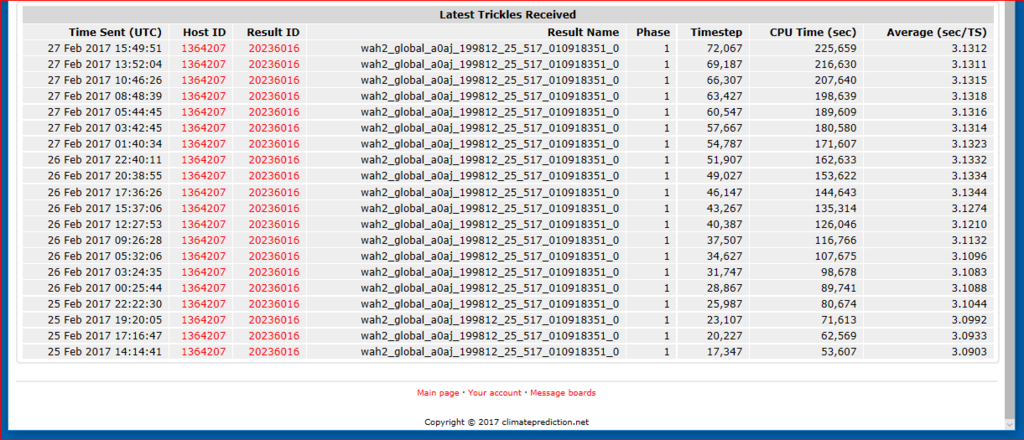
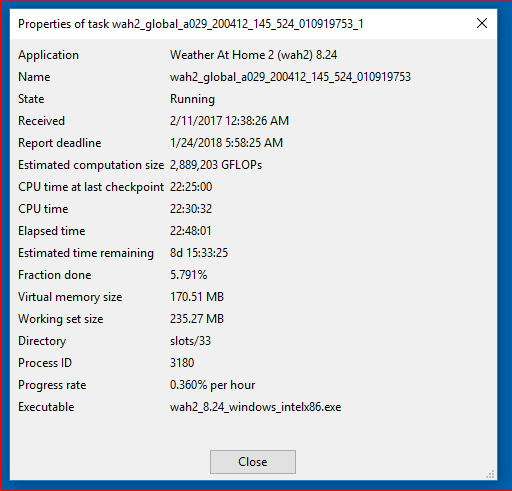
hi Iain, hi everyone, on my Windows 10 computer, the following wah2_global, Batch # 517 Completed successfully in 2 days 14 hours. Run time - 2 days 15 hours 6 min 47 sec CPU time - 2 days 14 hours 42 min 14 sec wah2_global_a0aj_199812_25_517_010918351_0  also on my Windows 10 computer, the following wah2_global, Batch # 524 Looks like it will take 8 or 9 days. i am just curious ..... does the _145_ mean 145 Zip files? wah2_global_a029_200412_145_524_010919753_1  |
 Iain Inglis Iain InglisSend message Joined: 16 Jan 10 Posts: 1084 Credit: 7,944,701 RAC: 2,164 |
..... does the _145_ mean 145 Zip files? ... when mine crashed it complained about all the missing Zips, right up to 145! |
 JIM JIMSend message Joined: 31 Dec 07 Posts: 1152 Credit: 22,363,583 RAC: 5,022 |
..... does the _145_ mean 145 Zip files? Mine is still running and its up to zip file 108, so the 145 most likely does mean 145 zip files. |
 Iain Inglis Iain InglisSend message Joined: 16 Jan 10 Posts: 1084 Credit: 7,944,701 RAC: 2,164 |
The new batch 594 of NAM50 mentioned elsewhere is indeed North America.  Thanks to WB8ILI for the Zip file from which the area image is derived. |
 Iain Inglis Iain InglisSend message Joined: 16 Jan 10 Posts: 1084 Credit: 7,944,701 RAC: 2,164 |
The new batch #717 of CARI25 mentioned elsewhere covers the eastern Atlantic to the Caribbean, which is an area of much recent concern.  |
 JIM JIMSend message Joined: 31 Dec 07 Posts: 1152 Credit: 22,363,583 RAC: 5,022 |
I can see why they would be interested in that area. For those who don’t live on the Gulf Coast or East Coast of the United States the area under study is the "Hurricane factory". In 2017 alone it produced 3 devastating Category 5 Hurricanes in one month. Half of Puerto Rico is still without electric power 6 months later! We definitely need to see what effect global warming is likely to have here. |
 Iain Inglis Iain InglisSend message Joined: 16 Jan 10 Posts: 1084 Credit: 7,944,701 RAC: 2,164 |
Models sometimes run faster or slower than expected from the GFLOPS estimate, and this table shows the relative accuracy of that estimate. In a mix of models, a model with a "normalised GFLOPS/sec" greater than 1.00 will finish earlier than expected. The extremes are the 13 month Central Africa model at 25 km resolution, which will finish in about half the expected time (1.93), and the 145 month global model at 25 km resolution which will take almost twice the expected time (0.54). The table hasn't been updated for a while because - apart from my trusty Mac mini - all my other machines failed. Compared with earlier versions this table differs in that most models have a relative GFLOPS/sec near 1.00, which indicates that the GFLOPS estimates are less variable than before (WAH2 8.24 seems to be the reason for that). I haven't run every type of model and don't have GFLOPS estimates for those, and machine performance varies so you may get better or worse performance. Model Duration Estimate Variation
ID            GFLOPS     App    Normalised GFLOPS/sec
AFR25/12                 7.08
AFR50/9                  8.24
AFR50/12      1,776,974  8.24   1.31
AFR50/13      1,924,645  8.12   1.15
                         8.24   1.31
AFR50/120                8.24
ANZ50/8       1,346,181  8.24   1.37
ANZ50/13      2,184,053  8.24   1.40
ANZ50/120                8.24
CAFR25/13     5,222,246  8.24   1.93
CAFR25/120               8.24
CAM25/5                  8.24
CAM25/10      3,212,387  8.24   1.35
CAM25/18      5,773,759  8.24   1.36
CAM25/120                8.24
CAM50/12        784,376  8.24   0.74
CAM50/13        849,559  8.12   0.65
CAM50/120                8.24
CARI25/11     3,532,559  8.24
DUB25/12                 8.12
DUB25/13      3,327,828  8.12   0.69
EAS50/10      1,482,156  8.24   1.10
EAS50/12      1,777,602  8.24   1.07
EAS50/13      1,925,325  8.24   1.10
EAS50/120                8.24
EU25/12       1,903,330  8.12   0.63
EU25/13       2,061,502  8.12   0.65
                         8.24   0.72
EU25/120                 8.24
EU50r/3         209,165  8.24   0.95
EU50r/4         278,121  8.24   0.91
EU50r/13        898,721  8.12   0.90
EU50r/120                8.24
GLOBAL25/1               8.24
GLOBAL25/2               8.24
GLOBAL25/3               8.24
GLOBAL25/16     319,399  8.24   0.56
GLOBAL25/25     498,688  8.24   0.55
GLOBAL25/133             8.24
GLOBAL25/145  2,889,203  8.24   0.54
MEX50/12        784,376  8.12   0.64
MEX50/13        849,559  8.12   0.66
MEX25/5                  8.12
MEX25/13      4,172,902  8.12
NAM50/13      2,014,634  8.24   1.50
NAM50/120                8.24
NAWA25/1                 8.12
NAWA25/12                8.24
NAWA25/13     3,327,828  8.12
NAWA25/120               8.24
PNW25/16      1,277,597  8.24   0.97
PNW25/21      1,616,017  8.24   0.94
PNW25/24      1,915,068  8.12   0.80
                         8.24   0.98
PNW25/48                 8.24
PNW25/49      3,907,164  8.19   0.97
                         8.24   0.98
PNW25/60      4,783,686  8.24   0.97
PNW25/80                 8.24
PNW25/120                8.24
SAFR50/120               8.24
SAM25/13      4,172,902  8.24   1.06
SAM25/120                8.24
SAM50/12                 8.24
SAM50/13      2,147,398  8.12   1.19
                         8.24   1.42
SAM50/16      2,641,684  8.24   1.41
SAM50/120                8.24
SAS50/3         348,111  8.24   0.93
SAS50/8         921,921  8.12   0.81
                         8.24   0.93
SAS50/12      1,380,969  8.24   0.91
SAS50/13      1,495,731  8.12   0.77
                         8.24   0.93
SAS50/120                8.24
WUS25/9                  8.19
WUS25/16                 8.24
WUS25/21                 8.24
WUS25/24                 8.24
WUS25/25      3,291,506  8.24   1.21
WUS25/120                8.24
Based on 402 models run singly across Windows, Mac and Linux machines. |
 geophi geophiSend message Joined: 7 Aug 04 Posts: 2187 Credit: 64,822,615 RAC: 5,275 |
Looks like the GFLOPS is entirely based on "Measured floating point speed" from boinc benchmarks. I thought in the past the boinc estimated time to complete a task was based on past completions of that model type by that PC. But no matter how many I complete of a given region/resolution on a PC, it doesn't seem to sway the estimate. Is this because we are just running wah2 models and boinc sees this as generic wah2 no matter the area/resolution, or doesn't boinc alter estimates based on past completions anymore? |
 Iain Inglis Iain InglisSend message Joined: 16 Jan 10 Posts: 1084 Credit: 7,944,701 RAC: 2,164 |
I have a vague memory that a BOINC Manager upgrade changed things, but I confess to not following those changes too closely. The new system of using only the task GFLOPS estimate and the machine "Measured floating point speed" to get the time does lead to estimated remaining time behaving oddly sometimes at the end, either decreasing too slowly or too quickly. I've never tried it but the fraction_done_exact configuration option presumably corrects that. [Edit: On my principal Windows machine, using the "Measured floating point speed" as the speed estimate gives about the right time for the global models, with everything else completing faster. If the "Measured floating point speed" was used for that machine rather than averaging over all my machines then the "Normalised GFLOPS/sec" values in the earlier table would range from 1 to ~3.6 - i.e. global models would finish as predicted by BOINC Manager and everything else up to 3.6 times faster. Tricky business!] |
 Iain Inglis Iain InglisSend message Joined: 16 Jan 10 Posts: 1084 Credit: 7,944,701 RAC: 2,164 |
The new batch #741 of SAFR50 mentioned elsewhere covers southern Africa. There were two small batches previously (#718 and #733) but I managed to snaffle a Zip file this time, so here is the region map.  |
 Iain Inglis Iain InglisSend message Joined: 16 Jan 10 Posts: 1084 Credit: 7,944,701 RAC: 2,164 |
Some higher resolution models (25 km) have come out for areas that have previously been modelled at lower resolution (50 km). There may be other pairs, but the ones I have seen issued are: AFR50/25, CAM50/25, MEX50/25 and SAM50/25. Of those I have run models for the CAM (Central America) and SAM (South America) pairs, and here are the area comparisons for those.   |
 Iain Inglis Iain InglisSend message Joined: 16 Jan 10 Posts: 1084 Credit: 7,944,701 RAC: 2,164 |
A new Atlantic region has just appeared at 50 km resolution. This region is clearly of interest given events in recent years and in the next few days.  Since the area is not rotated, it actually makes more sense plotted directly on an unprojected map background.  |
 JIM JIMSend message Joined: 31 Dec 07 Posts: 1152 Credit: 22,363,583 RAC: 5,022 |
I’ve wondered for a long time why no one seemed to be modeling the hurricane belt. |
|
Send message Joined: 15 Jan 06 Posts: 637 Credit: 26,751,529 RAC: 653 |
I’ve wondered for a long time why no one seemed to be modeling the hurricane belt. I am wondering what you can say about such extreme and specific events though. Perhaps a study of the likelihood and intensity over the long term? |
 Dave Jackson Dave JacksonSend message Joined: 15 May 09 Posts: 4559 Credit: 19,039,635 RAC: 18,944 |
George asked the team at Oxford about this and got the following reply. Hi George, |
 Iain Inglis Iain InglisSend message Joined: 16 Jan 10 Posts: 1084 Credit: 7,944,701 RAC: 2,164 |
Here is the East Asia 25 km resolution model area currently being processed in batch #996 compared with the earlier 50 km model area. There was a recent EAS25 batch (994), which might have been a different size, but I didn't get one so couldn't plot it.  |
 Iain Inglis Iain InglisSend message Joined: 16 Jan 10 Posts: 1084 Credit: 7,944,701 RAC: 2,164 |
Here is the New Zealand 25 km resolution model area currently being processed in batch #1005. There have been NZ models before, but I didn't manage to get any so couldn't plot the area.  |

©2025 cpdn.org